
Measuring Performance with CloudWatch Custom Metrics and Insights
27 Apr 2020tl;dr: CloudWatch Insights is great if you can log JSON and only consider the last few weeks, otherwise I suggest asynchronous log analysis with a detached lambda function.
In a previous article, I explained how you can use CloudWatch Custom Metrics to monitor an application’s health. In this article we will look at the serverless scheduler, and use custom metrics to monitor the performance of its most critical component.
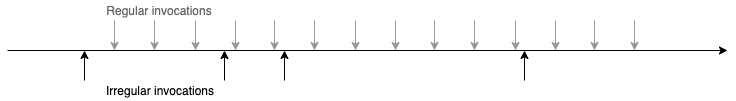
The serverless scheduler solves the problem of ad hoc scheduling with a serverless approach. This type of scheduling describes irregular point in time invocations, e.g. one in 32 hours and another one in 4 days. While scale is usually not a problem with serverless technologies, keeping the precision high can become a challenge.
The serverless scheduler accepts payloads with a date about when they shall be sent back. It uses SQS to prepare events that are up to 15 minutes away from their target date and then publishes them with a lambda function called emitter. This function receives the events a second early and waits for the right moment to publish them. The reason for this is that cold starts can add a couple hundred milliseconds of delay.
The emitter function is also where we know how much delay there is between the expected date and the date that we managed to deliver the payload back. The lower this delay, the better our precision. We track the delay in milliseconds.
In previous tests I use Python’s matplotlib to build charts, now we’ll take a look at how CloudWatch can support us here. Bonus: We can register alarms in CloudWatch to notify us when things go south.
But first, let’s report the performance data performantly.
4 Ways You Can Report Metrics
CloudWatch has an API to upload metric data. We can use this API on (1) every event, (2) per execution of the emitter function, (3) somewhen later by asynchronously processing the logs, or (4) not at all by using CloudWatch Insights instead.
Please note that your function requires the permission cloudwatch:PutMetricData to upload metric data.
On Every Event
Reporting metrics is straightforward. Decide on a namespace to upload your metrics under, choose a metrics name and put in the delay. You can find the full details on the AWS Documentation.
import boto3
cloudwatch = boto3.client('cloudwatch')

def handle(event, context):
    for item in event.get['Records']:
        publish_event(item)
        delay = get_delay(item)
        put_metrics(item)

def put_metrics(delay):
    cloudwatch.put_metric_data(
        Namespace='serverless-scheduler',
        MetricData=[
            {
                'MetricName': 'emitter-delay',
                'Value': delay,  # e.g. 19
                'Unit': 'Milliseconds',
            },
        ]
    )

def publish_event(event):
    # sends the event to the sns topic
    # specified in the event

def get_delay(event):
    # calculate the time until the
    # event shall be fired
This approach is good if your function processes just one event at a time and you don’t hit lambda’s concurrency limits. In other situations you may quickly notice a significant downside of this approach: We don’t make use of batching. In the worst case we establish a new connection for every event.
Even if we don’t establish a new connection for each event, the code still waits for the network call to complete. To put the speed of network calls into perspective, have a look at Computer Latency at a Human Scale.
How about we report metrics just once?
Per Function Execution
If our function processes multiple events per execution, we can report the performance metrics in one go. To do this, we first collect, then aggregate, and finally submit all the data to CloudWatch once.
import boto3
cloudwatch = boto3.client('cloudwatch')

def handle(event, context):
    delays = []
    for item in event['Records']:
        publish_event(item)
        delays.append(get_delay(item))

    values, counts = aggregate_delays(delays)
    put_metrics(values, counts)

def put_metrics(values, counts):
    cloudwatch.put_metric_data(
        Namespace='serverless-scheduler',
        MetricData=[
            {
                'MetricName': 'emitter-delay',
                'Values': values,
                'Counts': counts,
                'Unit': 'Milliseconds',
            },
        ]
    )
To ensure that we publish all the events as quickly as possible, we only collect the delay values. After the important work is done, we start doing analytics.
The batch parameters of the PutMetricData API expect an array of values and a correspoing array of counts, where each item in the counts array describes how often a given value has occurred.
values[0] = 200
count[0] = 10

==> The value 200 has occurred 10 times
To prepare these two arrays, the function aggregate_delays can be implemented in the following way:
def aggregate_delays(delays):
    # group the delays in a map
    delay_map = {}
    for delay in delays:
        if delay not in delay_map:
            delay_map[delay] = 0
        delay_map[delay] += 1

    # break it apart into two arrays
    values = []
    counts = []
    for value, count in delay_map.items():
        values.append(value)
        counts.append(count)

    return values, counts
However this approach still takes up runtime of the emitter, which could be needed for sending other events instead. The next approach will move the metrics reporting outside of the emitter function.
Asynchronous Log Processing
By detaching the analytics from the emitter, we can make sure that the core application performs only the most important work. To do this, you can use the serverless framework to attach a lambda function to another one’s log stream.
In the following snippet of the serverless.yml, we register a function called analyzer to be invoked when new logs arrive at the log group /aws/lambda/serverless-scheduler-emitter. We also add a filter so that only those logs make it to the function, where the field log_type has the value "emit_delay". Learn more about the Filter and Pattern Syntax.
functions:
  analyzer:
    handler: my_handler.handle
    events:
      - cloudwatchLog:
          logGroup: '/aws/lambda/serverless-scheduler-emitter'
          filter: '{$.log_type = "emit_delay"}'
To use these filters, the log event must be in JSON format. We let the emitter output the relevant data as a JSON string.
# simplejson can handle decimals better
import simplejson as json

def handle(event, context):
    for item in event['Recods']:
        publish_event(item)
        delay = get_delay(item)

        log_event = {
            'log_type': 'emit_delay',
            'delay': delay
        }
        print(f"{json.dumps(log_event)}")
We then implement the lambda function that is listening to the log stream.
import gzip
from base64 import b64decode
import simplejson as json

import boto3
cloudwatch = boto3.client('cloudwatch')

def handle(event, context):
    # log events are compressed
    # we have to decompress them first
    log_events = extract_log_events(event):
    delays = []
    for log_event in log_events:
        delays.append(int(log_event['delay']))

    # use the aggregation from the previous example
    # to reduce the number of api calls
    values, counts = aggregate_delays(delays)
    put_metrics(values, count)

def extract_log_events(event):
    compressed_payload = b64decode(event['awslogs']['data'])
    uncompressed_payload = gzip.decompress(compressed_payload)
    payload = json.loads(uncompressed_payload)
    return payload['logEvents']

# ... functions from previous example ...
Now every time there are new logs, the analyzer function is invoked and reports the delay metrics.
But wait, there’s another ad hoc approach which requires even less code.
CloudWatch Insights
In the previous section we started logging JSON. These logs can be used by CloudWatch Logs Insights to generate metrics from logs. All without building and deploying new analyzer functions!
#AWSLambda protip: Thou Shalt Log JSON! (and then you just use cloudwatch insights for searching across all the whole log group easily instead of fucking around with log streams)!
— Gojko Adzic (@gojkoadzic) April 23, 2020
The emitter now prints JSON logs like {'log_type': 'emity_delay', 'delay': 156}. To visualise the delays we open CloudWatch Logs Insights in the AWS console, select the right log group and use CloudWatch Logs Query Syntax to build a query which aggregates the delay data.
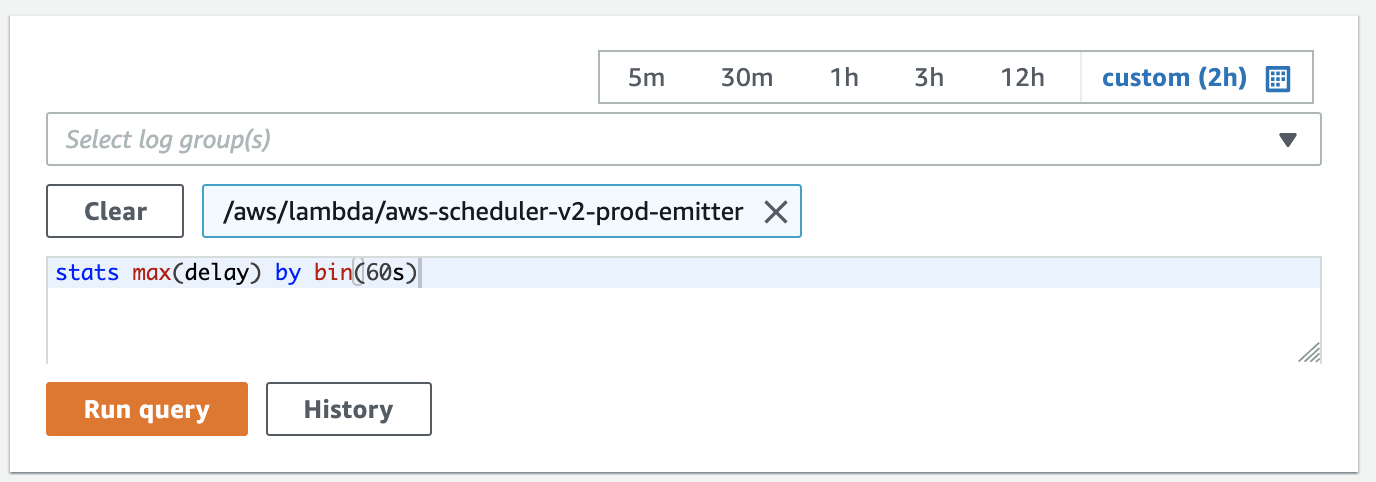
The query stats max(delay) by bin(60s) builds an aggregate (stats) of the maximum delay (max(delay)) for every minute (bin(60s)).
After running the query, we see a logs, and a visualization tab. Here’s the visualization:
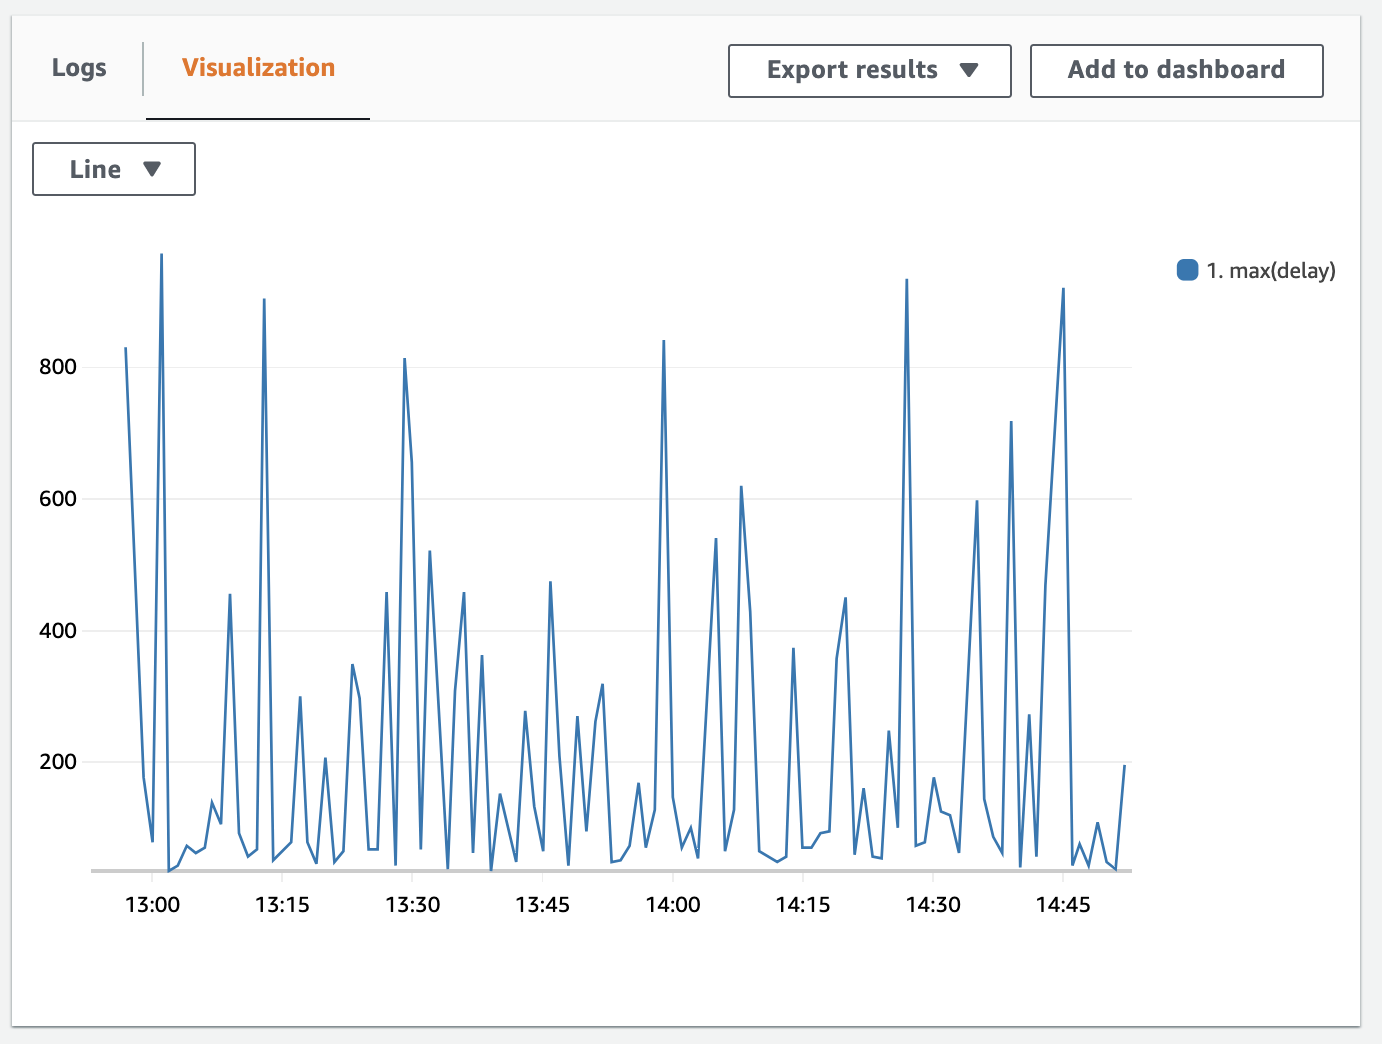
With a click on “Add to dashboard” we can build a widget out of this metric and add it to one of our existing dashboards. We’ll look more into visualizing in the next section.
Note that this approach is based on CloudWatch logs, where you pay $0.03 per GB of storage. If you only need metrics for the last few weeks, then CloudWatch Insights with a 14 or 28 day log retention period is okay. Otherwise Custom Metrics are cheaper for long term storage.
Visualize It
In a recent article I explained how to turn custom metrics into graphs and how to build a dashboard. This time we take a look at how we can make the best out of the delay metrics, and spice them up with a reference line.
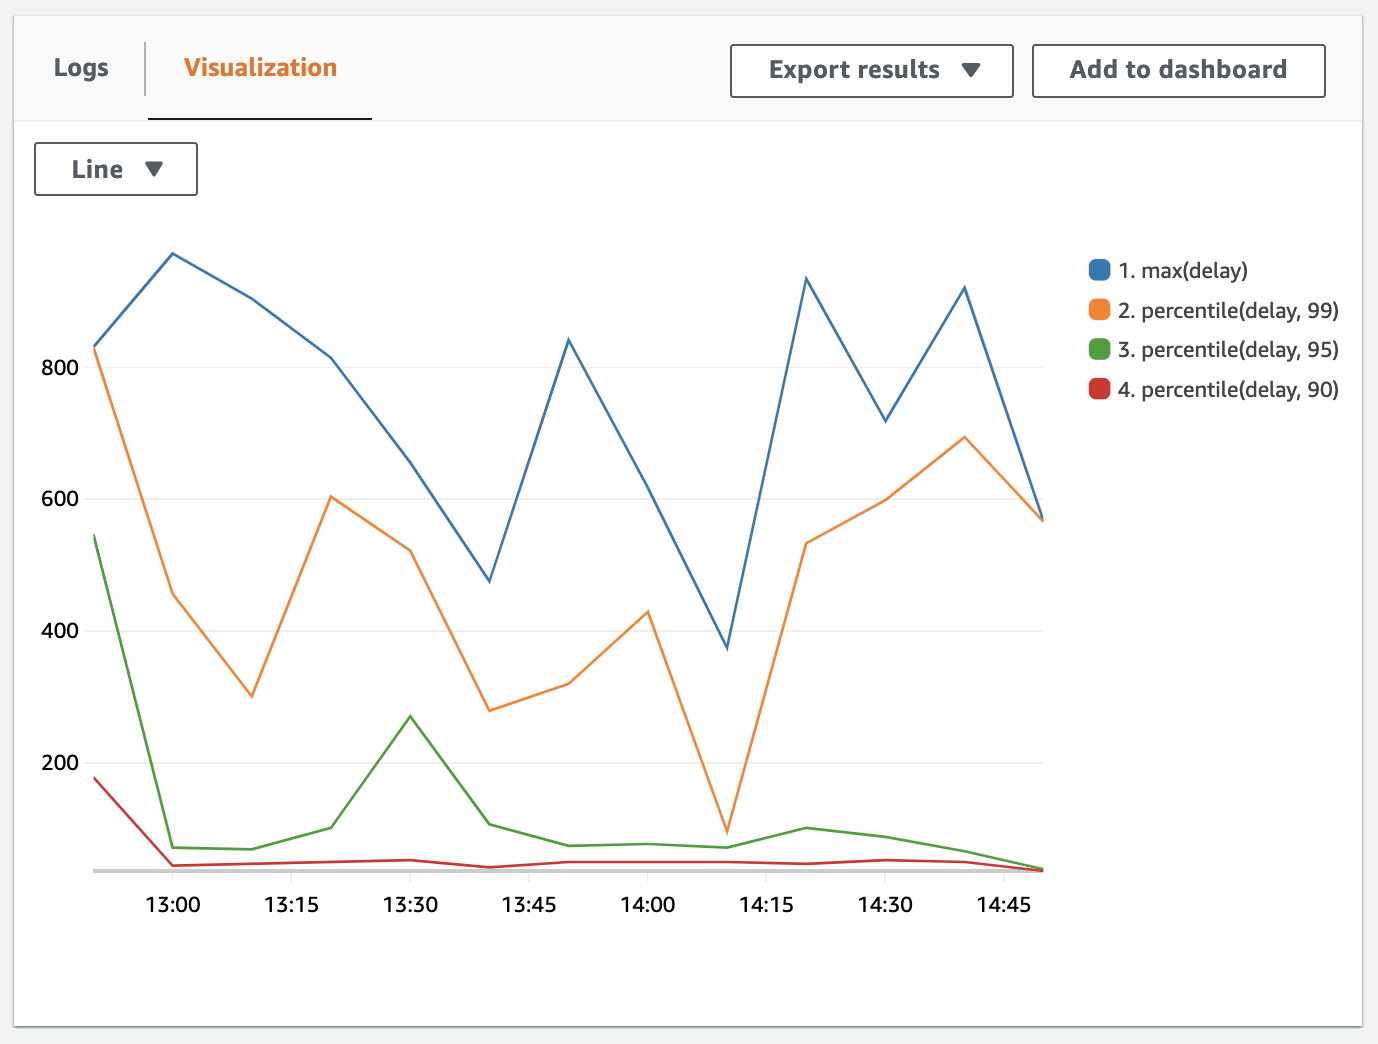
Looking at the maximum delay, we can quickly understand what the worst example is. But using percentiles allows us to better understand how bad the situation really is. If your maximum delay is 14 seconds, but that only occurred once, then the situation isn’t too bad. If however the 90% percentile (i.e. p90) rises to 10 seconds, then a significant number of customers will be impacted. P90 describes the best 90%.
To better understand the various percentiles, you can use the following query to plot out the max, p99, p95 and p90. I’ve increased the bin to 10 minutes so that the lines don’t overlap too much.
stats max(delay), percentile(delay, 99), percentile(delay, 95), percentile(delay, 90) by bin(10m)
The visualization gives us four lines.
Reference Line
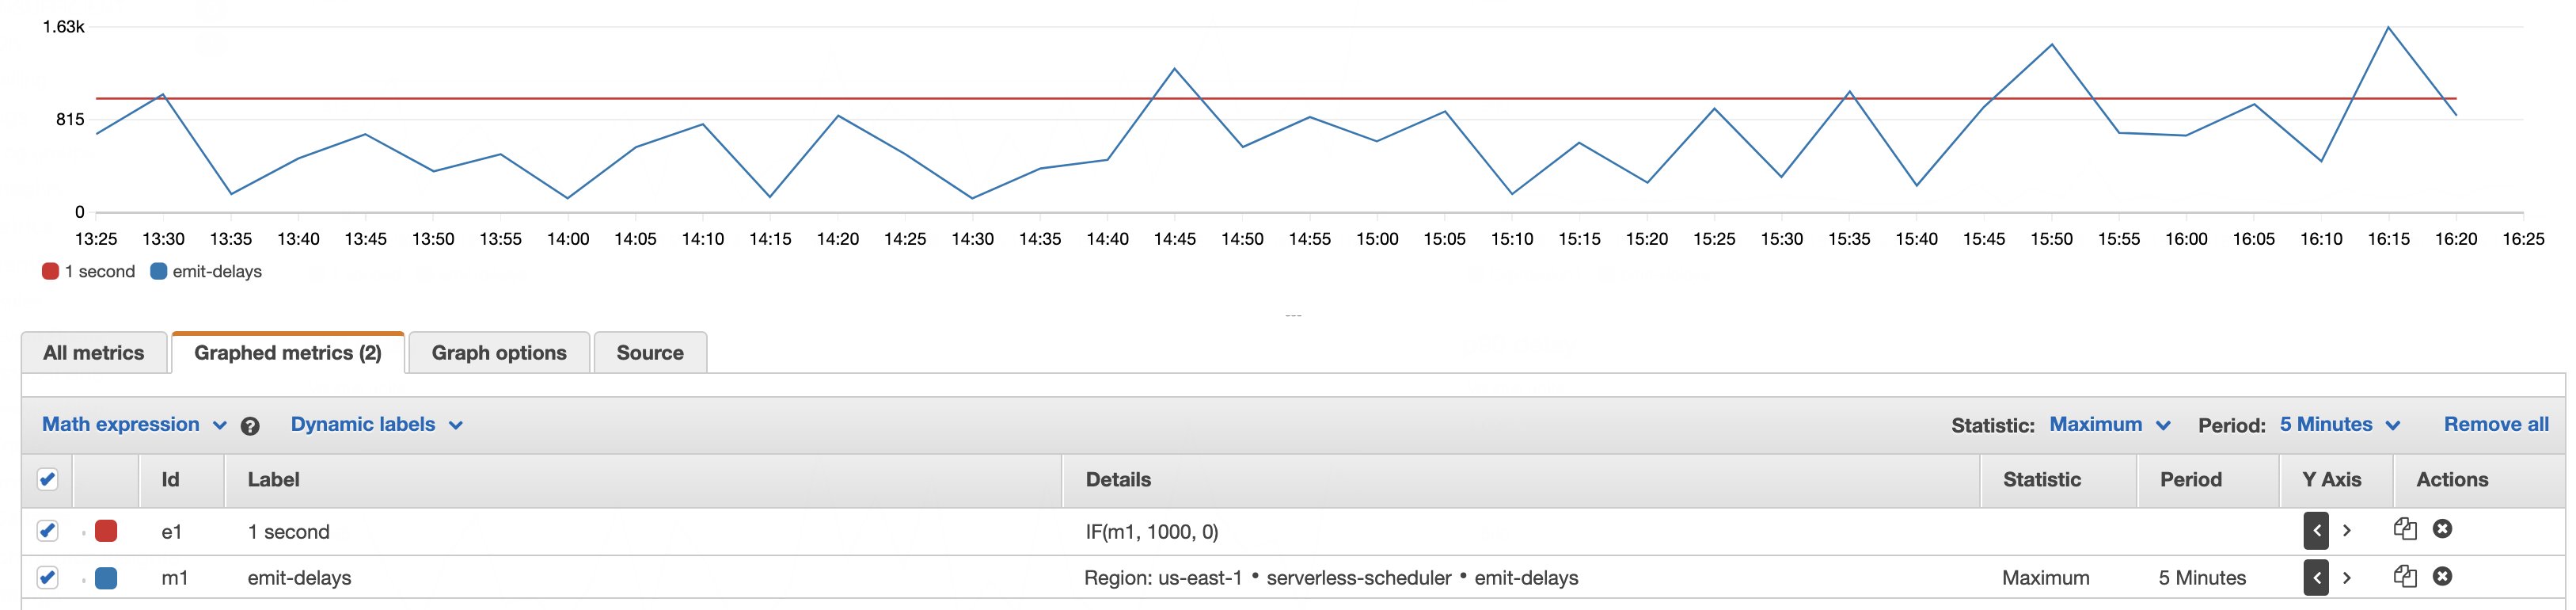
If you’re building graphs from custom metrics, you can add a reference line to indicate a threshold. With the serverless scheduler my reference line is 1 second. I have not found out how I can add static values through CloudWatch Insights and will therefore use regular CloudWatch metrics instead. Let me know if you know more!
Once you selected a metric, you can add a reference line by adding the formula IF(m1, 1000, 0). Replace 1000 with your reference value. This expression will print a reference line, if the other data series m1 has a value.
Alarms
If too many delays are above our reference line, we should investigate if there’s a new bug or increased load breaks the system. The quickest way to learn about that is to use CloudWatch Alarms. In a previous article I explained how you can set up alarms that send you an email.
Conclusion
In this article we learned 4 approaches to generating metric data, each with their own little trade offs. CloudWatch Insights is great if you only consider the last few weeks, otherwise I suggest asynchronous log analysis.
Further Studying
- AWS re:Invent 2018: Introduction to Amazon CloudWatch Logs Insights (DEV375)
- CloudWatch Alarms
- CloudWatch Logs Insights Query Syntax
- Amazon CloudWatch Synthetics for more complex testing and monitoring
Enjoyed this article? I publish a new article every month. Connect with me on Twitter and sign up for new articles to your inbox!