
Monitoring an application's health with CloudWatch Custom Metrics
13 Apr 2020For most applications it makes sense to trigger CloudWatch alarms when lambda functions throw errors. Throwing errors on unwanted behavior is a best practice which also allows you to make use of standard metrics and redrive mechanisms. However some applications may have trade offs between concurrency and blast radius, which don’t allow them to rely solely on errors for the health of their application.
In this article I will show you how I use custom metrics to verify that an application’s core process is healthy. We will also take a look at the operational cost of this solution.
Context
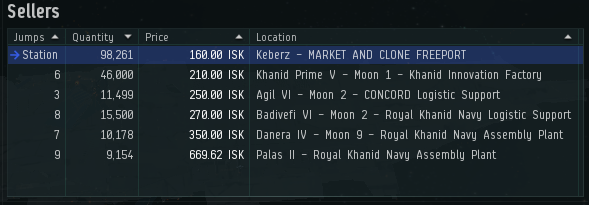
The application “Eve Market Watch” lets players of the MMORPG Eve Online define market thresholds for various items. When the available amount drops below that threshold, the user gets a notification so they can restock the market. In the picture below, a threshold of 100,000 would trigger an ingame mail while a threshold of 90,000 would not yet.
The core process (market parser) takes all the user defined thresholds, pulls in market data from the game’s API and figures out which items are running low. If the number of processed items drops significantly, then something has happened that I should investigate, be it a market that’s not available anymore or a new bug.
The application has a trade off between concurrency and blast radius. The optimal blast radius would be one lambda per user and market, which keeps the application intact for all users, while allowing for quick isolation of the problematic ones. However I’m using the free plan of redislab to cache before writing to DynamoDB. The free plan of redislab has a limit of 30 connections, while the application currently has 370 active users.
Goal
If the market parser breaks, I want to know about that before my users do. There have been a couple times where I repeatedly broke the core process without noticing it.

To achieve this, the market parser shall track the number of items being processed so that an alarm can fire if that number drops significantly.
Here is where CloudWatch custom metrics and alarms come into play.
Custom Metrics
Custom metrics allow you to collect arbitrary time series data, graph it and trigger actions.
To collect custom metrics you need at least a namespace, a metric name, a value and a unit. You can find the full details on the AWS Documentation. You may also define dimensions to increase the granularity of your data. The following examples use Python 3.7 with AWS’ boto3 client for CloudWatch.
import boto3
cloudwatch = boto3.client('cloudwatch')

cloudwatch.put_metric_data(
    Namespace='marketwatch',
    MetricData=[
        {
            'MetricName': 'my-metric-name',
            'Dimensions': [
                {
                    'Name': 'dimension-name',
                    'Value': 'dimension-value'
                }
            ],
            'Value': 123,
            'Unit': 'Count'
        },
    ]
)
The namespace is a string which lets you link multiple metrics to an application or domain. In my example I use marketwatch as the namespace.
By setting a good metric name, you can identify your new metric amongst others and understand what data it holds. In my example I use snapshots-built, as this is the number of items that the market parser was able to get data for.
As for the metric value I send the number of items that have been processed and use the unit Count. See the documentation for all available units.
You may increase the metrics’ granularity with up to 10 dimensions. Beware that you can only define CloudWatch alarms on the highest granularity. In my example I add one dimension, which distinguishes between real data that I got from the markets, and zero values which are added when no data is available.
All things together the function that sends the metrics looks like this:
def put_metrics(count, snapshot_type):
    cloudwatch.put_metric_data(
        Namespace='marketwatch',
        MetricData=[
            {
                'MetricName': 'snapshots-built',
                'Dimensions': [
                    {
                        'Name': 'type',
                        'Value': snapshot_type  # can be 'real' or 'virtual'
                    }
                ],
                'Value': count,
                'Unit': 'Count'
            },
        ]
    )
I intentionally don’t set a timestamp so that CloudWatch registers the event at the timestamp it is received. “Data points with time stamps from 24 hours ago or longer can take at least 48 hours to become available for GetMetricData or GetMetricStatistics from the time they are submitted.” - API PutMetricData
Permissions
You have to grant your function the permission to submit metrics. If you’re using the serverless framework, you can add the following permission to your serverless.yml.
provider:
  ...
  iamRoleStatements:
    - Effect: Allow
      Action:
        - cloudwatch:PutMetricData
      Resource: "*"
For more details check the api documentation for PutMetricData.
Testing
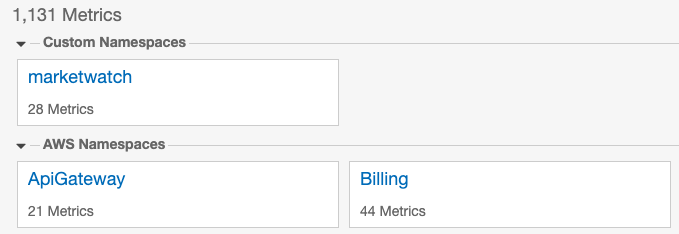
Once the code is deployed and running we go to the CloudWatch Metrics, look up our metric and verify that our code is collecting data. Once your code submitted the first metrics, you will see your new namespace under “Custom Namespaces”.
Open the dashboard, drill down into the right category and explore the available data.
Visualization
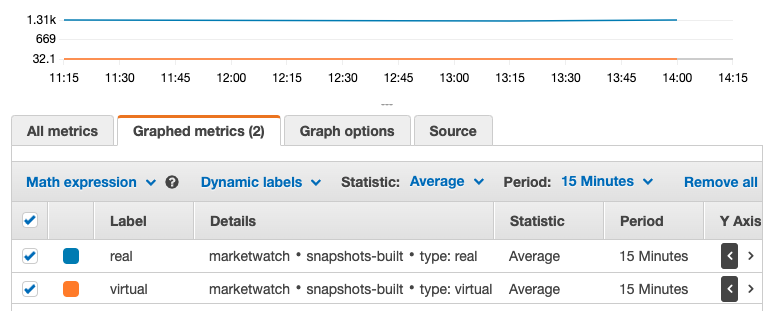
Once you found your data, continue by creating a graph which visualizes your data. Select the data series you want to visualize and adjust the “Graphed metrics”. When you see many dots in your graph, you can increase the period so that the dots get merged into a line. You can also report metrics more frequently.
As the core process of my application runs every 15 minutes, it makes sense to average over a period of 15 minutes.
For more info about graphing metrics, check out the CloudWatch documentation.
Once you’re happy with the data and graphs you’re seeing, head over to the CloudWatch Dashboards where we will create our own dashboard.
Dashboard
Go to the CloudWatch dashboards and create a new one. Give it a name and add your first widget, where you recreate the graph from the last section. You will again see the screen from the last section where you select your custom namespace, your metrics and dimensions, and then build a graph with the appropriate settings. Give your graph a name and click on “Create widget”.
Resize the widget and add more as you need. Here’s how my dashboard looks:
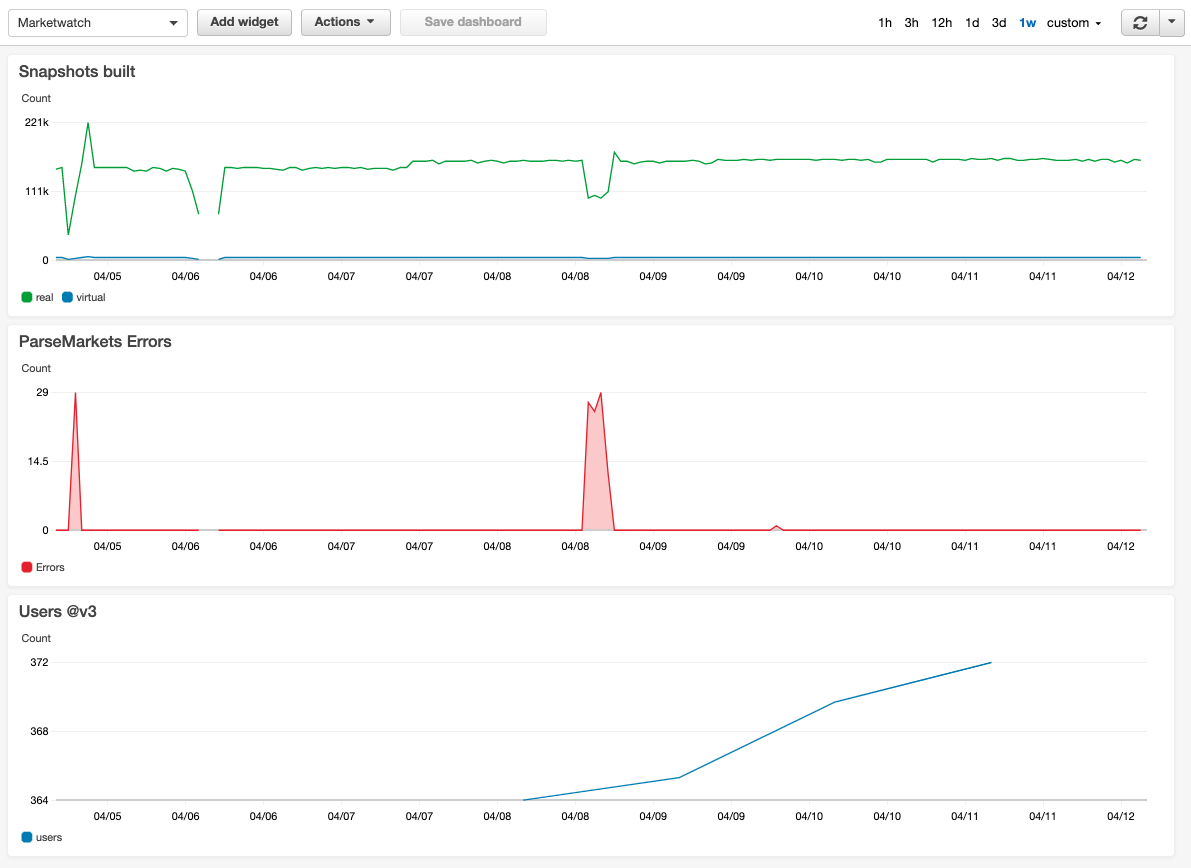
As you can see in the top graph on the left side around “04/06”, there is some lack of data. When my code stops working and doesn’t collect data anymore, an alarm should be triggered.
There is another drop after “04/08”. This one recovered itself within a reasonable time. I do not need an alarm for that situation, but should still analyze the problem later on.
Let’s look at creating alarms next.
Alarms
CloudWatch Alarms trigger an action when a given condition is met, i.e. response times exceeding 1000ms. In our example we want to fire an alarm, when the reported amount of processed items drops significantly for a prolonged time or is not reported at all.
To create an alarm, head over to the alarms section in CloudWatch and click on “Create alarm”. You will then be asked to select a metric, where you pick and plot a metric as we’ve done in the previous sections. Note that here you can only select one data series. You can’t aggregate various dimensions here.
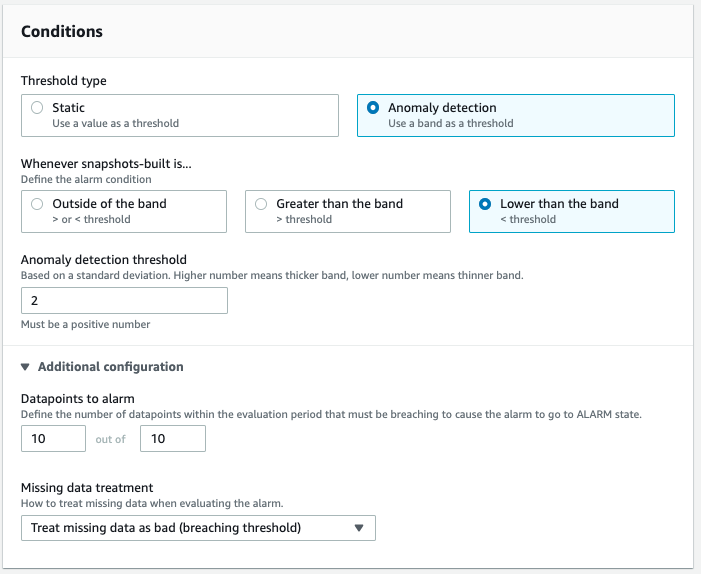
With the metric selected, you can define conditions. I decided to go with the “Anomaly detection” and picked “Lower than the band” as the threshold type. Play around with the anomaly detection threshold value to see what is best for your data. In the additional configuration I defined that 10 out of 10 datapoints need to breach the band before an alarm gets triggered. This way the app can recover itself in case an external API temporarily fails. I also decided to “Treat missing data as bad (breaching threshold)” as the alarm would otherwise not fire if my code breaks before the metrics are reported.
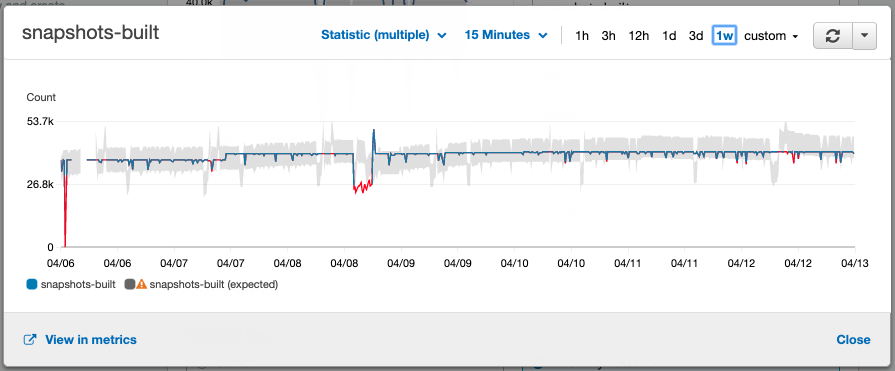
In the picture below you see a preview of the anomaly detection against the metrics I’ve collected. We see a few red drops where the anomaly detection triggers, but as we’ve configured the alarm to only fire if 10 out of 10 data points are bad, we only get alarms when the market parser does not recover. If you look closely, you also see regular drops in the gray anomaly band which are caused by the game’s daily downtime. CloudWatch correctly understands that this is a recurring behavior.
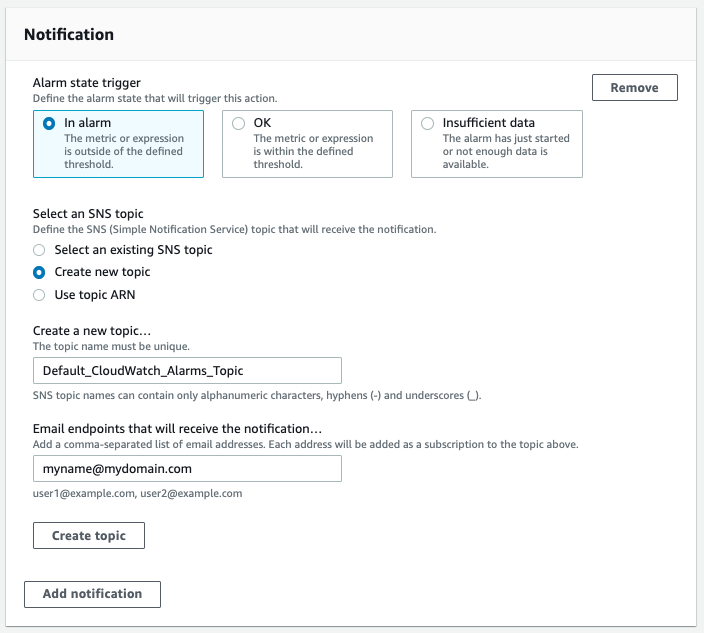
When my alarm fires, I want to receive an email. This is the easiest way to continue, but you may set up custom integrations through SNS topics, e.g. for Slack. To send alarms to an email, choose to “Create a new topic”, enter a name for the new topic and enter an email address that will receive the alarm. Click on “Create Topic” below the email input and then click on next to continue.
Finally give your alarm a name and finish the setup. To test your alarm you can update the trigger conditions or report metrics that will trigger the alarm. Make sure to check that you get an email as expected.
Cost Analysis
The operational cost of using custom CloudWatch Custom Metrics and Alarms consists of two parts: The ingestion and the monitoring.
Ingestion
Each custom metric that you submit data for costs $0.30 per month. Custom metrics are not covered by the free tier. “All custom metrics charges are prorated by the hour and metered only when you send metrics to CloudWatch.”
You also pay for the PutMetricData calls, but the first one million API requests are covered by the free tier, and then cost $10 per one million API requests. My application reports two metrics every 15 minutes, which is a total of 5,760 API requests per month.
Monitoring
We’ve set up one dashboard and one alarm. Each dashboard costs $3 per month, but the free tier covers three dashboards for up to 50 metrics per month. Each anomaly detection alarm costs $0.30 at standard resolution as it is made up of three alarms: “one for the evaluated metric, and two for the upper and lower bound of expected behavior”. If you select high resolution, which is 10 seconds instead of 60 seconds, you pay three times as much. As we’re only reporting data every 15 minutes, high resolution doesn’t make sense. The free tier covers up to 10 alarm metrics (not applicable to high-resolution alarms).
Total
For my application I expect to pay a total of $0.30 per month. Without the free tier I would still expect less than $5.
Conclusion
We saw how applications can collect custom metrics and how we can use CloudWatch to trigger alarms based on those metrics. I think the price is very fair, as small hobby projects with a few custom metrics can get away with a low price while medium sized enterprise software can remain under $100 per month.
If you would like to define alarms as code, have a look at this example. For all users of the serverless framework, this article explains how to add alerts.
Enjoyed this article? I publish a new article every month. Connect with me on Twitter and sign up for new articles to your inbox!