
Serverless Capacity Planning
07 Oct 2021With DynamoDB, performance isn’t a spectrum. It’s binary — yes or no. You know the exact limits where your access patterns won’t work anymore, whether it’s due to pagination on your Query or throttling on your hot keys.
This principle applies to other serverless services as well. You can run more and more Lambda functions concurrently, until at one point you can’t, because you’ve hit a service limit.
In the serverless world we still need capacity planning to make sure we don’t accidentally hit any limits that services like DynamoDB, Lambda, and CloudFormation impose on us. If our application continues to grow over time, we will eventually hit limits of various types.
Disclaimer: I’ve never done capacity with traditional servers, so the serverless perspective is my only one.
When we build an application that should scale, we must answer the question “When do I need to take action to let it keep growing?” or “How will I learn that I need to take action?”
Understanding at what point in time your application will encounter a limit is very difficult. Instead, we can set up alarms that tell us when we need to get active, review our usage, and maybe start work to prevent our application from hitting a limit.
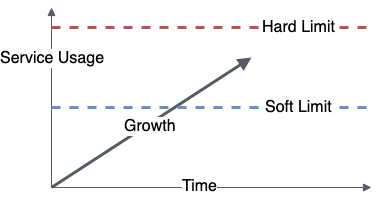
Just like with traditional servers, the remaining capacity for serverless applications is about how many additional requests you can handle, or how much more data you can add to individual records, before your application starts to break down. Due to Lambda’s ability to run up to tens of thousands of executions in parallel (default is 1,000), it’s usually other services’ soft and hard limits we encounter.
Paul Swail also has an article about capacity planning for serverless. He also covers cost estimation, which we won’t talk about in this article.
What are soft and hard limits?
Some AWS services impose soft limits, some impose hard limits, and some have both.
For example Lambda has a default soft limit of 1,000 concurrent executions. When you reach this soft limit, you can request a service limit increase, and shortly after you can have many more concurrent executions. According to their documentation you can increase this soft limit to “tens of thousands”.
DynamoDB has a hard limit on the partition throughput. If many users request the same record, this can lead to a “hot partition”, and eventually your requests get throttled. When your application encounters a hard limit, you must rewrite some parts to let it continue to grow.
You should to take action before you hit a limit. Therefore, you should have a good threshold that’s below the limit so that you can get active before your application gets throttled.
What’s a good threshold?
Be conservative! You can always change your mind and decide that your application grows slowly, and you have more time before you need to take action.
For soft limits I suggest that you create an alarm which triggers when you use more than 50% of a service limit. For the Lambda concurrent executions this would be 500. When the alarm triggers you can decide if you want to request a service limit increase, raise the threshold to e.g. 75%, or take no action at all because of a short spike in executions. Changing the threshold is a lot cheaper than losing customers due to an experience that’s slower than a sloth.
For hard limits you will need to change your application, e.g. by splitting up DynamoDB records that are growing in size and may exceed the 400kb item size limit. Changing your application requires development effort, planning, testing, and much more. To accommodate for this work, I suggest a 10x rule. If your traffic/data spikes by a factor of 10 overnight, will you hit a hard limit? If yes, start thinking about how you can change your application to not hit that limit. If you know that individual records in your DynamoDB table are currently 100kb, but won’t grow over 200kb, you can decide that this rule doesn’t apply. Measure, set conservative alarms, and let your system inform you when you need to take action.
Research which metrics are already available, and where you need to generate metrics yourself!
What should be in your capacity plan?
Here are a few steps that you can take for your capacity plan.
List all soft and hard limits for services that you use
Go through your application’s source code and understand which of the services that you depend on have limits. Extra points if you include services that might break your ability to deploy changes (e.g. CloudFormation resource exhaustion, or S3 bucket limit).
Once you know which services you use, go to CloudWatch and check which of those have built in CloudWatch metrics. Lambda concurrent executions is available by default, but if you want to track DynamoDB item sizes, you’ll need to add your own code. You can log this info in the Embedded Metric Format to let CloudWatch generate metrics for you. There is for example the NPM package aws-embedded-metrics that helps you with EMF.
You can now take this information and compare it against existing usage, e.g. from active users, load tests, or your own usage.
Understand which limits you will hit first
With the information about service limits and metrics from your application (e.g. load tests), you can take a guess which ones you’ll hit first. For these you can decide if you should take action now, or if an alarm is sufficient at this time.
Focus your effort on the services limits that you’ll hit first, and expand from there. Start with an alarm on built in CloudWatch metrics, and when necessary add your own code to produce more metrics. One alarm is better than no alarm.
Create alarms
Once you have cloudwatch metrics, you should start to create conservative alarms. For example with Lambda concurrent executions you can set an alarm for 50% of the maximum available concurrency, so that you can request a service limit increase way before your application actually hits the limit.
Your capacity plan should have action items to set up alarms, and gather necessary metrics if they are not available yet.
Will it scale to 10x?
Do you already see any hard limits that you may reach with a 10x increase of application usage? You might have to change your application eventually to not hit those limits. Use your own best judgement if that’s necessary now, or some time in the future.
Keep in mind that depending on your application and internal processes this change might take months or years. There’s no standard way for this, so allocate enough time for a rework. For example, you might have to split large DynamoDB records into smaller ones, or store them in S3.
The goal of the 10x question is not to over-optimize early, but to get an understanding of problems that might arise, so you can fix them early enough.
Give me some examples!
Below you find examples for DynamoDB and Lambda. The approach I took was to look at the access patterns in our application, then read through the service limits and list anything that applies. With that information we can decide where we need to gather additional metrics, when alarms should trigger, and when we need to start rewriting parts of your application to cope with hard limits.
DynamoDB
Let’s assume an example where we model a job platform, with companies, and their job offers. We have two tables, one for the companies, and one for the job offers. In each table we store records with a UUID partition key. This means that for example AWS has the partition key some-uuid and Stripe has the partition key some-other-uuid. Each record in the job offers table also has their unique partition key. If you’re an advanced DynamoDB user you might want to use single table design, but to make things easier to understand we won’t use this concept here.
Looking at DynamoDB’s service limits, we see that the following limits apply to us:
- 40,000 Read Capacity Units (RCUs) / Write Capacity Units (WCUs) per table with on-demand capacity (soft limit)
- 3,000 RCUs and 1,000 WCUs per partition (hard limit)
- 400kb item size (hard limit)
It can be difficult to guess how many users that will support, but we don’t really need to do know that. It’s more important for us to know when we need to request a service limit increase, or when we need to rewrite parts of our application.
There are CloudWatch metrics for the table throughput. The other limits can either be prevented by default (not accepting items that are too large), or adding EMF logs to create metrics ourselves. I don’t have a good idea on how to measure throughput per partition at this time. If we can’t measure it or need significant effort to measure it, we might just start changing our application now by adding a CloudFront cache to reduce read throughput on individual records.
Knowing about the limits and having metrics, we can set up alarms that trigger early enough. Unless you know how fast your application grows, I suggest using a very conservative threshold, like 50% of 40,000 capacity units. When it triggers, and you see that your application grows rather slowly, you can adjust the alarm to something more reasonable.
Lambda
Following up on the example above we assume there are two Lambda functions, one for reading data from the tables and one for writing data to the table.
Looking at Lambda’s service limits, we see that the following limits apply to us:
- 1,000 concurrent executions (soft limit)
- 900 seconds maximum runtime (hard limit)
We may break the 1,000 concurrent executions if we get too much usage (which is a good problem). Knowing that we can’t predict how often a user will refresh the page, or how active they will be throughout a day, it’s better to set a conservative alarm threshold before hitting the limit. For example a threshold of 500 concurrent executions should allow us to get a service limit increase approved before we actually hit the limit.
I also included the 900 seconds maximum runtime as that’s a hard limit for Lambda, but not a reasonable one for our use case. Customers probably won’t wait for 15 minutes before they get a response, and if your function is behind ApiGateway, it will only have 29 seconds anyway. So for a Lambda function running behind ApiGateway the actual hard limit is 29 seconds. Again for our customers that’s probably too long, and we want to go with something more reasonable like 1 second. You may notice by this point that there’s no hard limit here that we should follow, but rather understand how our product will be used, and if we need to be more strict before making changes to our application.
If we know that a function will take longer as our table grows (e.g. because of a full table scan), we can decide to directly use a different approach where runtime won’t increase with the size of the table, or accept the risk and set alarms to notify us when a rewrite becomes necessary.
Conclusion
Serverless capacity planning is about understanding the amount of traffic that your application and services that you rely on can handle. As we’re transitioning to serviceful development, it becomes more and more important to know the services that we use, and to understand how far we can increase the limits, and when we need to change our application.
We don’t need to know how quickly our service grows, but we should have mechanisms in place so that we take action early enough.
Resources
- Alex DeBrie about DynamoDB Limits
- DynamoDB’s service limits
- Lambda’s service limits
- Paul Swail about capacity planning for serverless
- Embedded Metric Format
- aws-embedded-metrics on NPM
Enjoyed this article? I publish a new article every month. Connect with me on Twitter and sign up for new articles to your inbox!